La connaissance multimodale de la mobilité par les données et l’Intelligence Artificielle
Analyser les flux multimodaux de déplacements, mesurer les parts modales pour prendre des décisions éclairées et suivre leur impact.
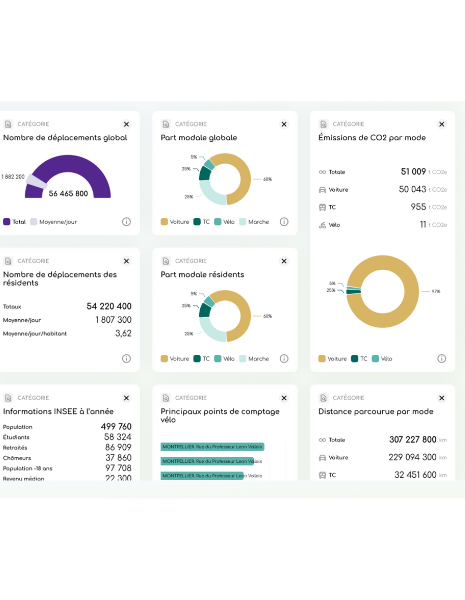
Visualisation des données
Une plateforme d’indicateurs fiables et de cartographies intuitives pour restituer une vision complète de la mobilité sur un territoire.
L’observatoire de la mobilité le plus complet du marché
Mobility-Metrix accompagne les autorités organisatrices et opérateurs de mobilité pour optimiser leurs offres pour une mobilité plus durable.

Analyse des Données

Mobilité Multimodale

Stratégie Durable

Comportement de déplacements

Politique Publique

Gestion des infrastructures
Notre solution

Traitement de Données
Transformation de données en informations exploitables grâce à un processus de mise en qualité, d’hybridation et de reconstitution.

Tableau de
Bord
Des décisions éclairées grâce à des analyses précises, des indicateurs clés et une visualisation dynamique de votre performance.
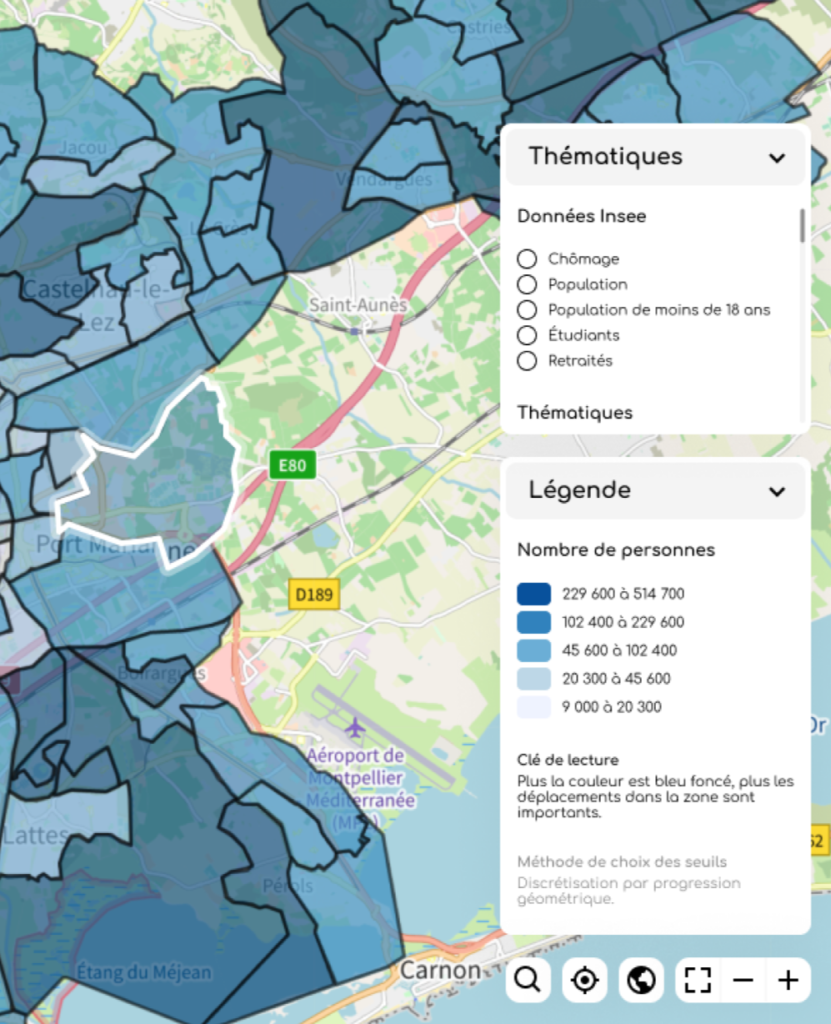
Une Cartographie Intuitive
Visualisez, analysez, optimisez : avec la cartographie intuitive de Mobility-Metrix, transformez vos données en décisions stratégiques.
UNE SOLUTION RÉFÉRENCÉE
MOBILITY-METRIX, COMMENT ÇA MARCHE?
Données en open data, données du territoire, données achetées via fournisseurs
Nettoyage des données sources & qualification du mode de transport
Greffe des qualités de données, recherche des variables avec les meilleures corrélations
Apprentissage des données manquantes par machine learning & redressement des volumes de déplacements
Parts modales, pôles émetteurs & générateurs de déplacements, flux Origine-Destination,
temps de parcours
Impact des données sur l’efficacité et la durabilité des solutions de mobilité
Ces chiffres soulignent l’importance cruciale des données pour une mobilité plus performante et durable.

ILS NOUS FONT CONFIANCE
ILS NOUS SOUTIENNENT
NOS ACTUALITÉS
- Mobility-Metrix rejoint Néo Mobilités 2025 à Bordeaux !Néo Mobilités 2025 : place aux mobilités de demain ! La mobilité évolue vite : électrification, connectivité, nouvelles règles, nouveaux usages… Autant de défis qui transforment nos véhicules, nos services, nos infrastructures et nos territoires. Mais c’est aussi une occasion unique d’innover et de créer de la valeur. Néo Mobilités et ses partenaires vous donnent…
- Retrouvez-nous aux Rencontres Nationales du Transport Public à Orléans🚀 Mobility Metrix vous donne rendez-vous à Orléans pour les Journées AGIR 2025 ! 📅 Du 4 au 6 novembre | 📍 Stand 51 B
- A la rencontre de l’équipeAujourd’hui Nadège CHEVALIER : Customer Success Manager


